Main Concept
Regression is a supervised learning technique used to predict continuous numeric values — any real number within a range. The output variable is continuous, meaning it can take many different values.
The simplest form is linear regression — finding a straight line that best fits your data and captures the trend. However, regressions can be simple (linear) or complex (nonlinear), and can operate in one dimension, two dimensions, or many dimensions.
How It Works
You plot labeled data points on a graph (e.g., height vs. weight). Then you fit a line (or curve) through these points that best represents the trend. Once you have this line, you can predict new values: look up an input value (e.g., height = 1.6m), trace to the line, and read the predicted output (e.g., weight = 60kg).
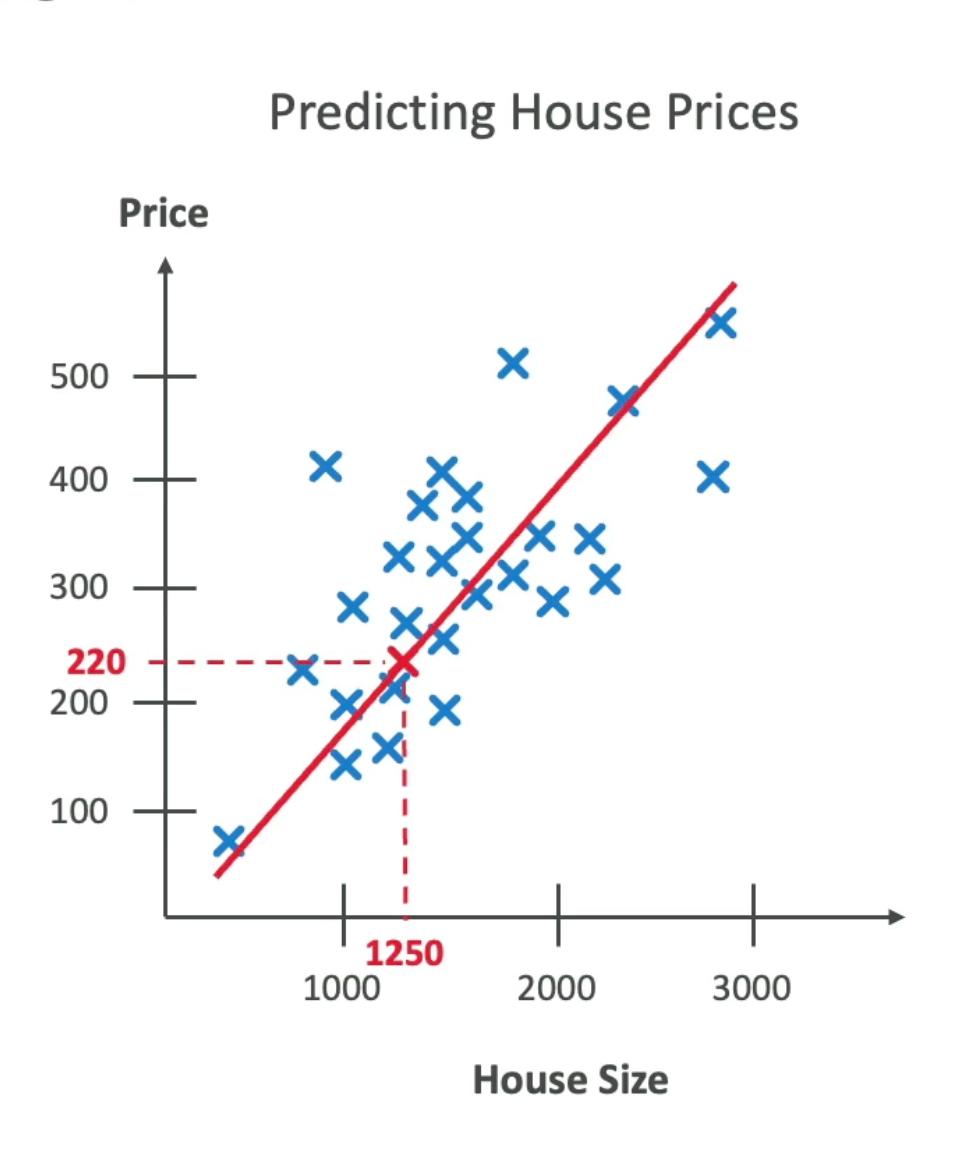
The line won’t pass through every point perfectly, but it captures the overall relationship.
Key Characteristics
- Output is a continuous number — not a category, but any real value
- Captures trends — finds the relationship between inputs and outputs
- Not perfect — the model makes predictions with some error, but that’s expected
- Scalable — can work with simple two-dimensional problems or complex multi-dimensional ones
Common Regression Examples
| Use Case | Input | Output |
|---|---|---|
| House price prediction | House size, location, bedrooms | Price in $ |
| Stock price forecasting | Historical prices, volume, news | Future price |
| Weather forecasting | Atmospheric data, humidity, pressure | Temperature |
| Sales forecasting | Historical sales, season, promotions | Revenue |
| Height vs. Weight | Person’s height | Person’s weight |
Regression vs. Classification
| Aspect | Regression | Classification |
|---|---|---|
| Output type | Continuous number | Discrete category |
| Example | ”Price is $250,000" | "This is a dog” |
| Question it answers | ”How much?” or “How many?" | "What is it?” or “Which category?” |
| Data pattern | Points scattered around a line | Points grouped by category |
Algorithms for Regression
While the exam won’t ask you to code, you should recognize these common algorithms:
- Linear Regression — fits a straight line
- SVM (Support Vector Machine) — finds the best-fitting curve
- Neural Networks — learns complex nonlinear relationships
- XGBoost — uses ensemble methods for better predictions
- Decision Trees — makes predictions through branching logic
Why Regression Matters
Regression is used whenever you need to predict quantities or measurements:
- Business: forecast revenue, predict demand
- Finance: predict stock prices, assess risk
- Science: predict physical phenomena, model relationships
- Healthcare: estimate patient outcomes, predict disease progression
AIF-C01 Exam Relevance
The exam expects you to:
- Recognize regression problems (predicting a continuous value)
- Know that regression requires labeled training data
- Understand regression is one of two main supervised learning types
- Distinguish it from classification
Exam tip: If you see “predict a price, temperature, quantity, or measurement,” it’s a regression problem. If you see “classify, categorize, or identify,” it’s classification.